Bitcoin at $76,088: Weak Charts, Mixed Historical Clues
Bitcoin closed at 76,088.01 USDT. The 4h and 12h charts remain under pressure, while a smaller daily historical sample leaves room for a rebound. Three timeframes, real screenshots and clearly defined past outcomes.
Bitcoin looks weak across the 4-hour, 12-hour and daily charts. The historical comparison is less clear: quieter outcomes were the largest group, while the daily sample left some room for a rebound.
The useful question today is whether selling pressure starts to ease on completed candles. A low position in the Bollinger Bands alone does not tell us a recovery has started.
Data reference: the same close, three different lenses
This November 6, 2026 report uses Binance BTC/USDT in ChartSight. The last completed candle in all three views ended at 00:00 UTC on November 6 (09:00 KST), with a reference close of 76,088.01 USDT. Screens were captured around 03:32 UTC (12:32 KST).
The reference candles opened at November 5, 20:00 UTC for 4h; November 5, 12:00 UTC for 12h; and November 5, 00:00 UTC for daily. The charts also show a forming candle. Its moving price marker can differ from the closed reference used for the statistics.
All views use the published Price position · RSI + Bollinger combination: RSI over 14 candles and Bollinger Bands over 20 candles at two standard deviations. This report uses the indicator-condition section, which has its own timeframe selector. It does not use the separate top-10 chart-shape comparison.
4-hour: price is low in the range, but history has little directional edge
The closed 4h reading had RSI 42.745 and Bollinger band position 19.3928%. A band position of 0% is the lower band and 100% the upper band. This puts the close below the middle of its recent range; it is not, by itself, evidence of a bottom.
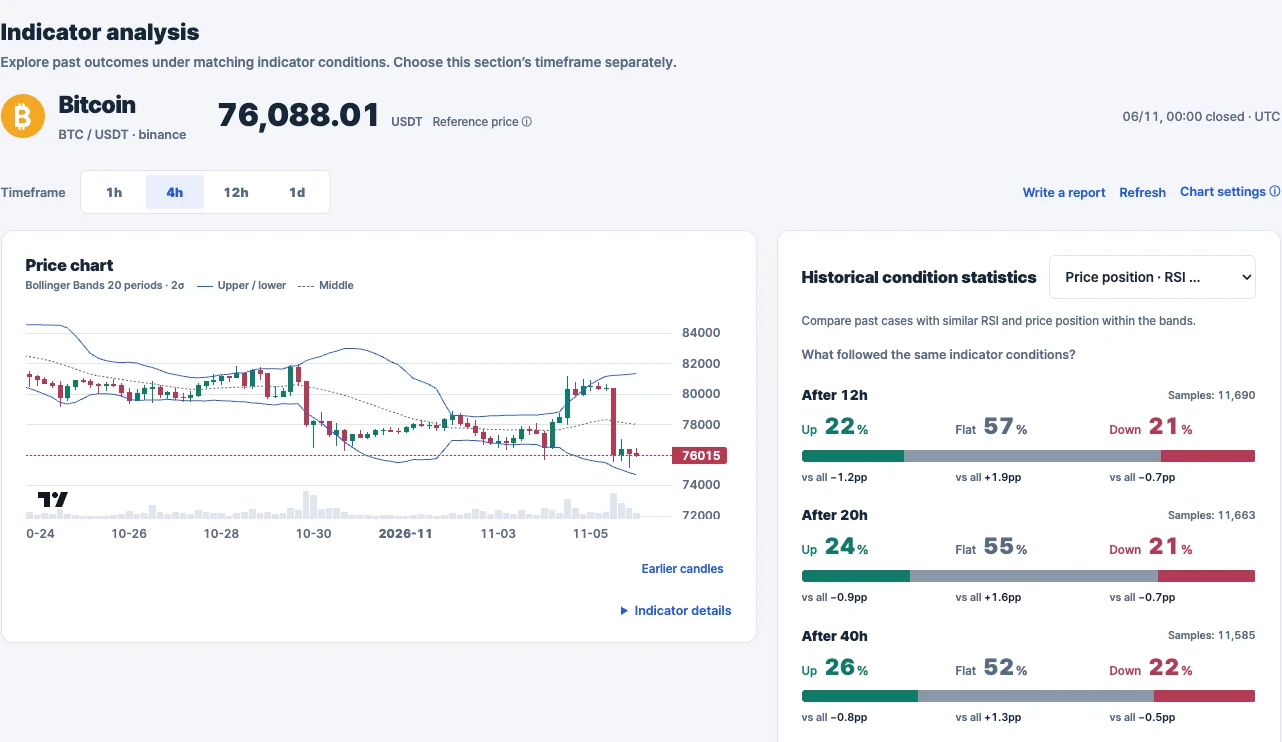
ChartSight grouped this reading with RSI at least 20 and below 80, and band position above 10% and below 90%. These are broad condition ranges, not thousands of near-identical charts.
For the next 12 hours, 11,690 eligible matching cases showed 22% Up, 57% Flat and 21% Down. The matching Up share was 1.2 percentage points below the site's all-eligible baseline. The one-point gap between the rounded Up and Down shares offers little directional separation.
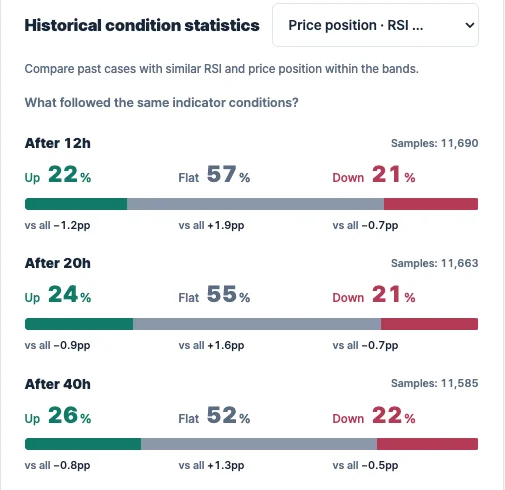
My reading: the chart shows pressure, but this historical group adds little support for a strong rebound call. The largest group was Flat, which has a specific volatility-based definition explained below.
12-hour: close to a condition boundary
The 12h reading had RSI 41.5938 and band position 10.0521%. Price was much closer to the lower Bollinger Band than to the middle, and just above the published 10% classification boundary.
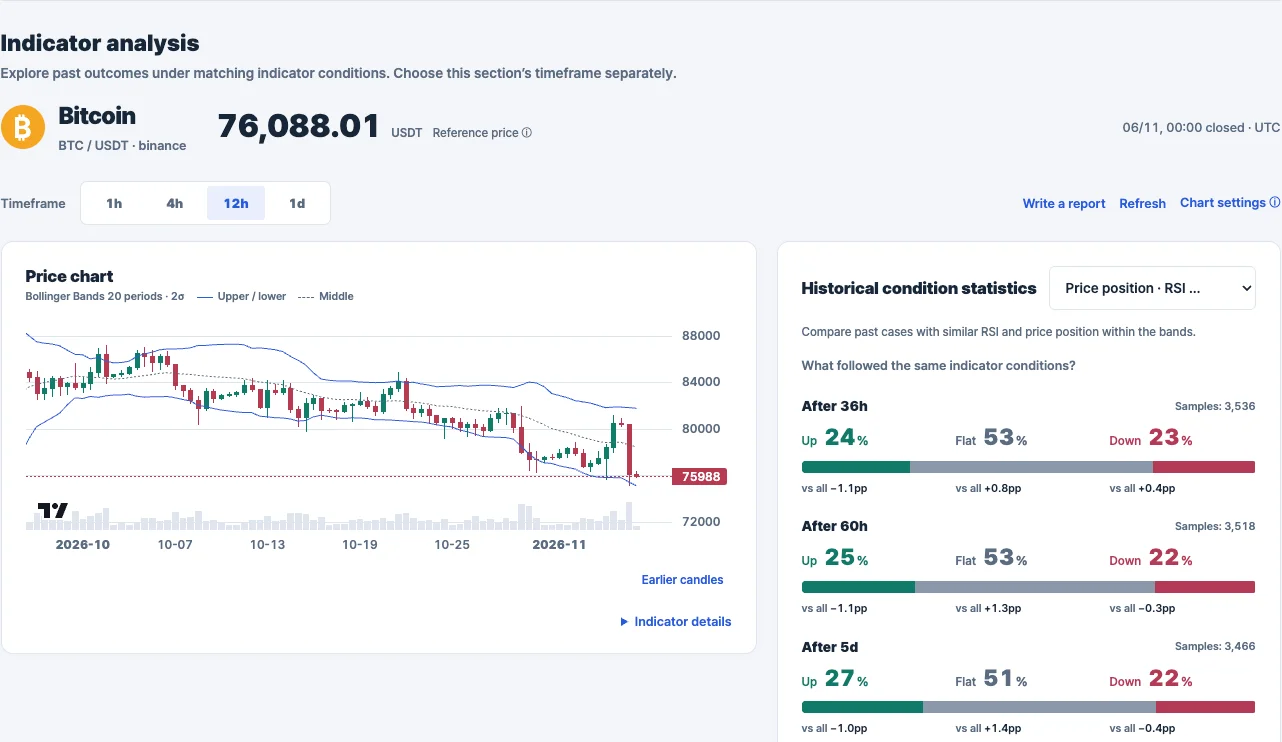
The selected ranges were still RSI 20 to below 80 and band position above 10% and below 90%. For the next 36 hours, 3,536 matching cases showed 24% Up, 53% Flat and 23% Down. The Up share was 1.1 percentage points below the all-eligible baseline.
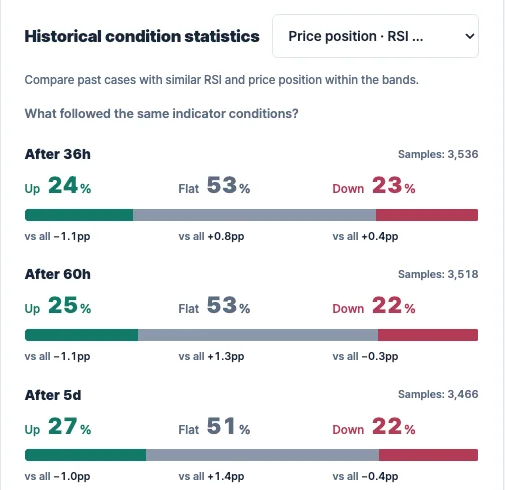
This is another weak current reading with a fairly balanced directional history. A small move across the 10% boundary could place the next reading in a different historical group. A changed percentage would therefore need to be read alongside the changed conditions, rather than treated automatically as a new market signal.
Daily: a rebound is possible, but the sample is smaller
The daily reading was weaker: RSI 34.3847 and band position 4.605%. The close sat close to the lower band. RSI was still inside the site's configured 20-to-below-80 range; the site did not label it oversold under those settings.
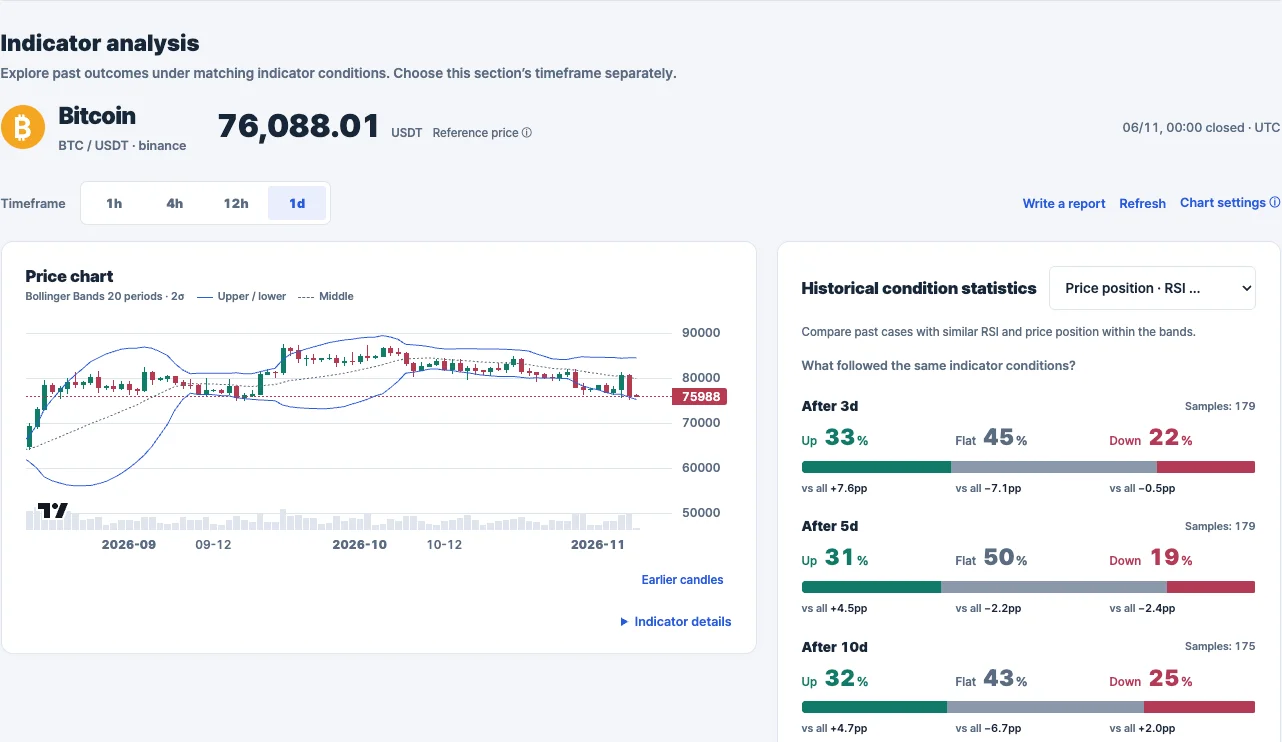
The daily band-position condition was 10% or lower, so this is a different group from the 4h and 12h comparisons. For the next three days, 179 matching cases showed 33% Up, 45% Flat and 22% Down. The Up share was 7.6 percentage points above the all-eligible baseline. Up was more common than Down in this group, but it was not a majority of outcomes.
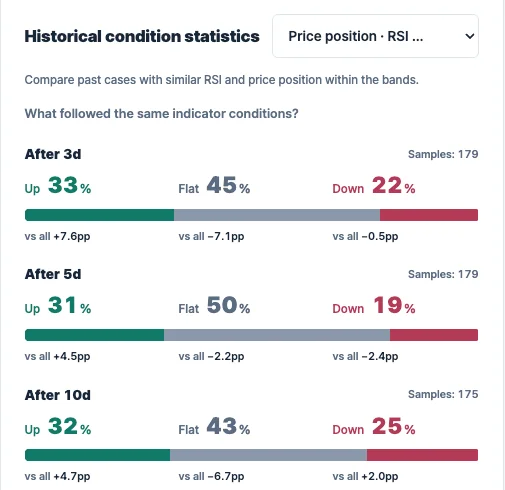
At five days the same displayed sample count of 179 showed 31% Up, 50% Flat and 19% Down. These historical outcomes leave a rebound scenario open. They do not establish that one is underway, and 179 potentially overlapping cases are a much smaller base than the thousands in the other views.
What would change this reading?
A recovery would look more convincing if later closed 4h and 12h candles moved back toward their middle Bollinger Bands and RSI strengthened. That is a condition to watch, not a trigger validated by the historical shares quoted here.
If closes keep sitting near the lower bands, the pressure remains visible even if there is a brief intraday bounce. The daily history is a reason to keep a rebound scenario in view; the shorter views do not provide strong historical confirmation of it.
The three views describe the same Bitcoin market at different speeds. They are not independent votes, and their percentages measure different future periods: 12 hours, 36 hours and three days. They should not be averaged into a single forecast.
How the historical numbers were measured
Up, Flat and Down refer to the future closing return at the stated horizon. Flat is the band within each historical case's own ±0.5σ return volatility, centered on zero. Up and Down lie beyond that band. Flat does not mean exactly unchanged, and these are not probabilities of touching a target during the period. The site does not assume normally distributed returns.
Coverage shown for the main rows used above:
- 4h / after 12h: January 18, 2019 to November 1, 2026 UTC; 11,690 matches out of 16,319 all eligible cases.
- 12h / after 36h: February 21, 2019 to October 30, 2026 UTC; 3,536 matches out of 4,958 eligible cases.
- Daily / after 3d: April 17, 2019 to October 28, 2026 UTC; 179 matches out of 2,207 eligible cases.
- Daily / after 5d: April 21, 2019 to October 26, 2026 UTC; 179 matches out of 2,177 eligible cases.
Those are the historical coverage windows displayed by ChartSight, not a claim that the comparison pool includes this morning's market. The closed reference is current to 00:00 UTC; the historical windows end earlier as listed.
The baseline includes the matching cases. Cases may overlap, percentages are rounded, and the displayed differences do not establish statistical significance. This report does not mix these three-way shares with the separate fixed ±1%, ±3% or ±5% grid, whose sample pool can differ.
Source: ChartSight dashboard, viewed November 6, 2026. Images are actual usage screenshots with enlarged statistics for readability. Technical indicators and historical frequencies are not future probabilities, guaranteed returns or investment advice.