Bitcoin Is Under Pressure. Is a Bounce Coming?
Bitcoin is under pressure. We examine completed 4-hour, 12-hour and daily candles and compare similar historical RSI and Bollinger Band conditions.
Bitcoin has fallen sharply. Is this a setup where the price has tended to recover—or has the weakness often continued?
To find out, we checked the most recently completed 4-hour, 12-hour and daily candles on ChartSight. We then looked at past cases in the same RSI and Bollinger Band categories.
The short answer: the longer-term comparisons show some past recoveries, but the 4-hour data is nearly balanced. None of these results confirms a bottom.
4-hour: The next 12 hours were nearly balanced
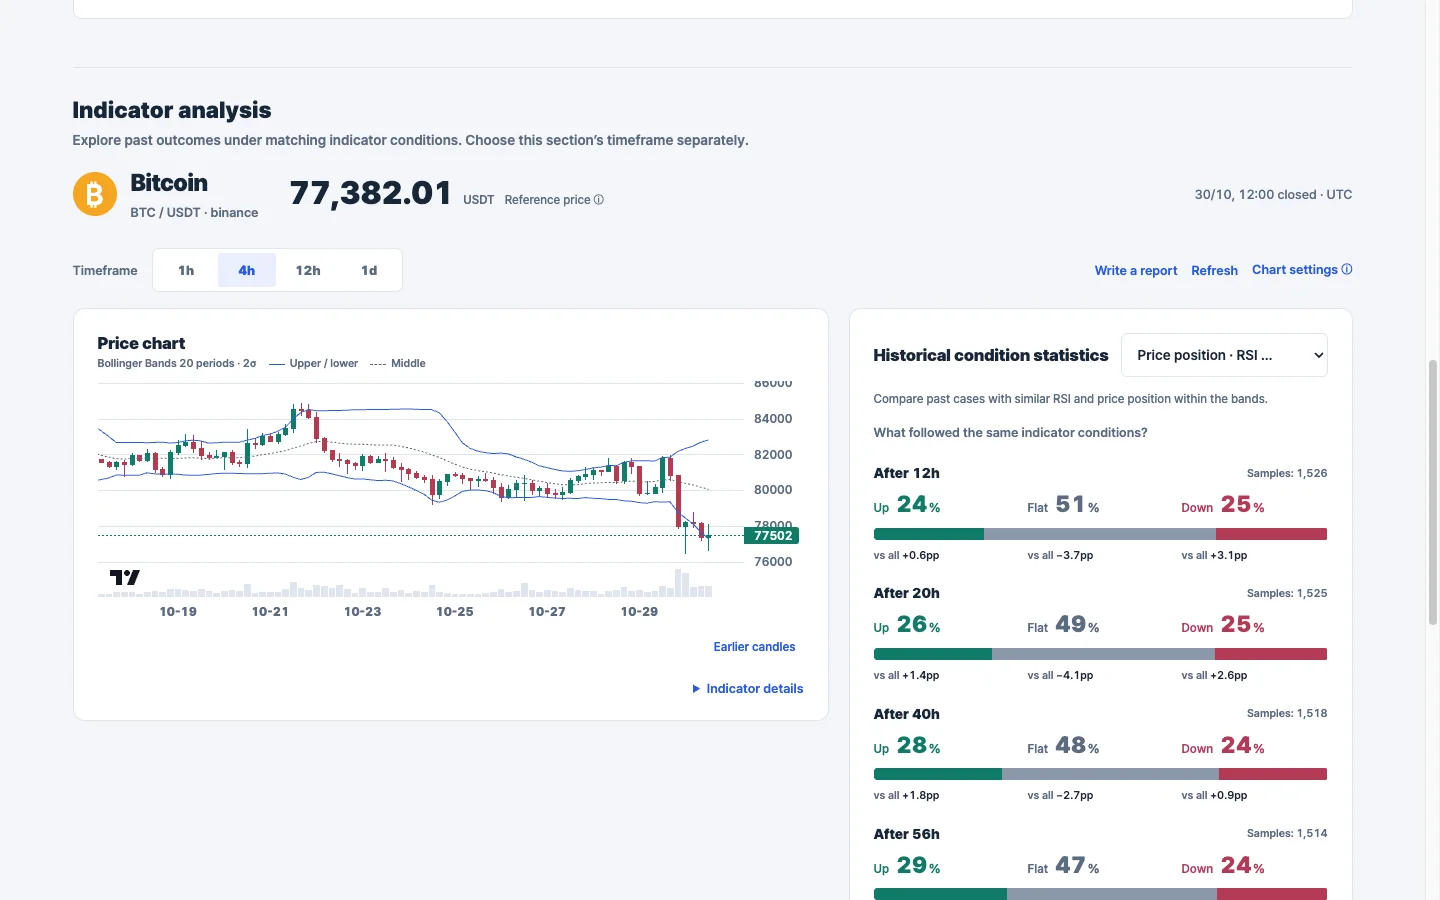
The completed 4-hour candle closed at 77,382.01 USDT at 12:00 UTC on October 30. Its RSI was 32.37, and the close was below the lower Bollinger Band.
In 1,526 historical cases in the same indicator categories, the outcome 12 hours later was:
- Up: 24%
- Flat: 51%
- Down: 25%
The upside and downside shares were almost identical. A close below the lower band alone did not show a clear short-term direction in these cases.
12-hour: A weak reading, but not a guaranteed bounce
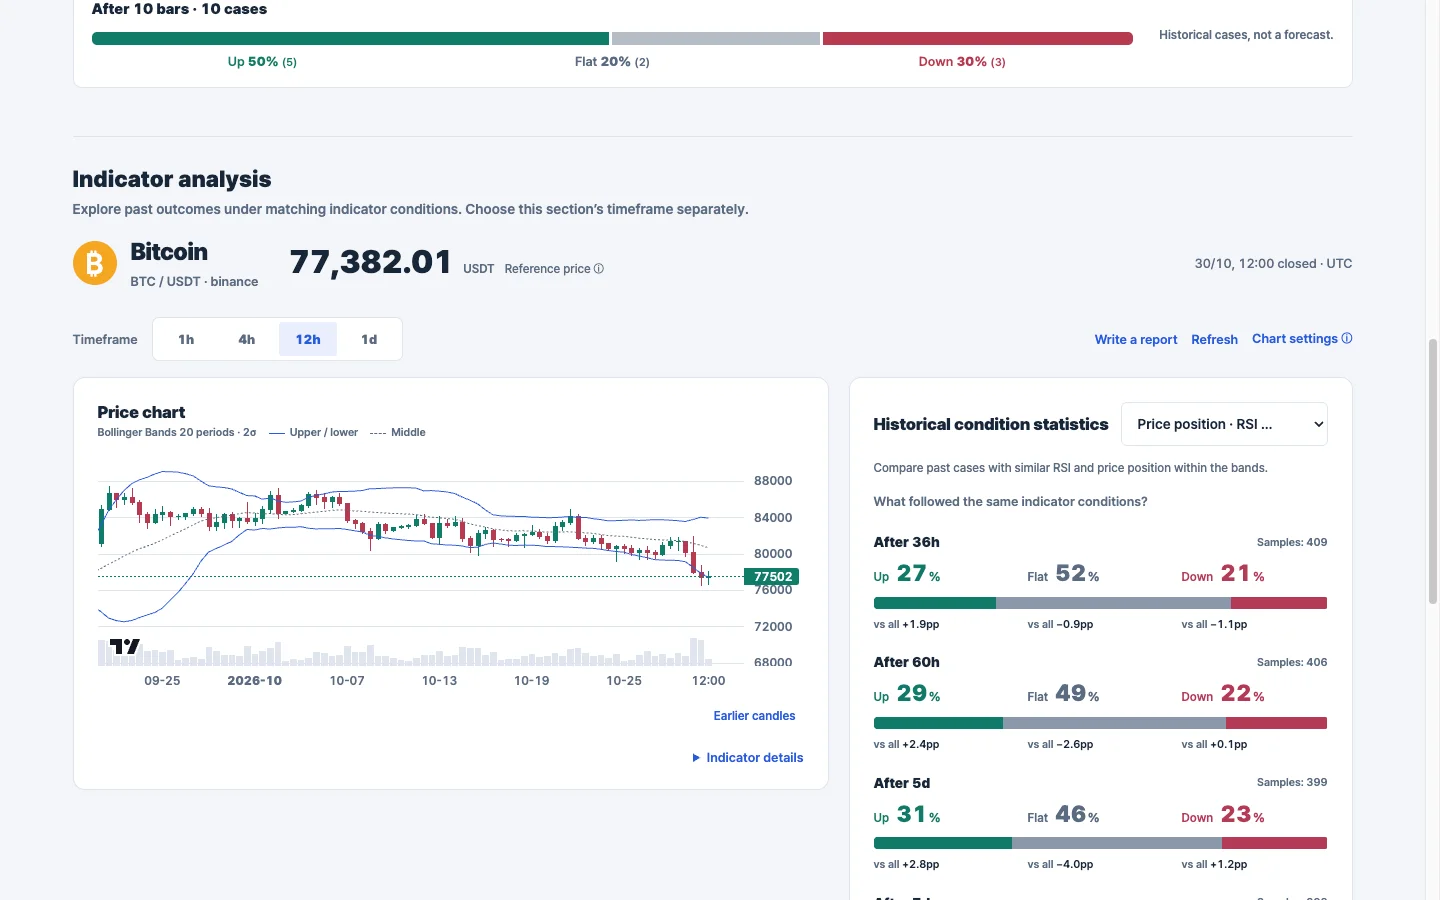
The completed 12-hour candle also closed at 77,382.01 USDT at 12:00 UTC on October 30. Its RSI was 23.87, and the close was below the lower Bollinger Band.
Across 409 historical cases in the same categories, the outcome 36 hours later was:
- Up: 27%
- Flat: 52%
- Down: 21%
More cases fell into the up category than the down category, but the gap was modest. An RSI below 30 is often called oversold; it does not mean the price must immediately reverse. Strong trends can keep an indicator low for a while. Fidelity explains RSI.
Daily: More past upward outcomes, with a smaller sample
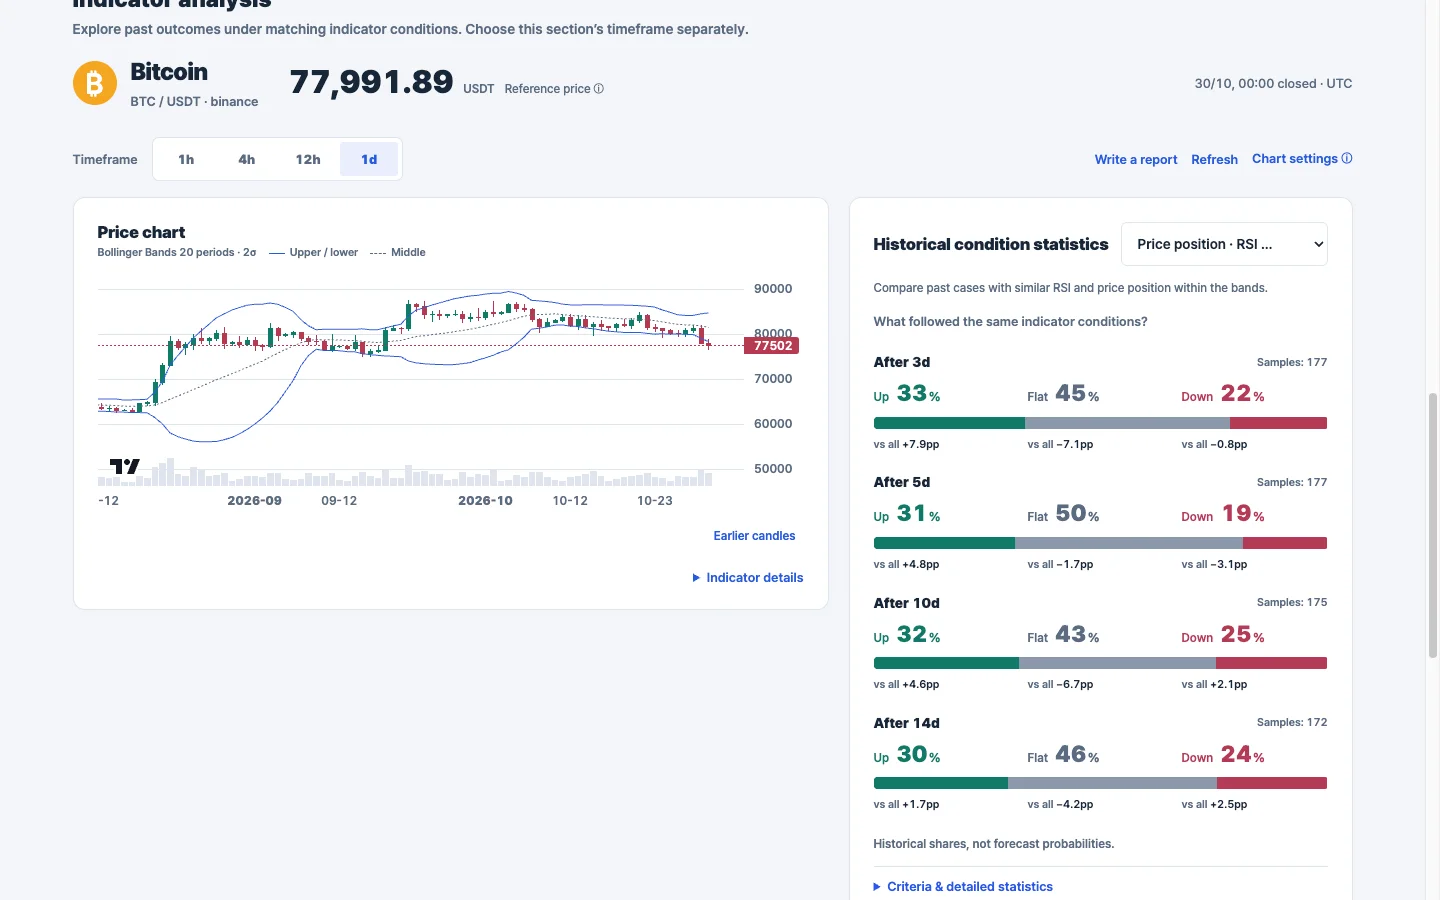
The completed daily candle closed at 77,991.89 USDT at 00:00 UTC on October 30, below the lower Bollinger Band. Its RSI was 32.57.
Among 177 historical cases in the same categories, the outcome three days later was:
- Up: 33%
- Flat: 45%
- Down: 22%
The share of upward outcomes was 7.9 percentage points higher than in the broader eligible comparison. That is worth watching, but the sample is relatively small and the difference alone does not establish a reliable edge.
What to watch next
The 12-hour and daily comparisons show more upward than downward outcomes in these past categories, while the 4-hour comparison is nearly even. That is a mixed picture—not a confirmed reversal.
A stronger recovery would need to show up in subsequent completed candles. Continued lower closes, on the other hand, would show that the weakness has not yet cleared.
Bottom line: The longer-term data gives us a reason to watch for a bounce, not a reason to assume one.
How this analysis works
The screenshots are from the ChartSight BTC/USDT dashboard, checked around 15:50 UTC on October 30, 2026. The analysis uses completed reference candles, not the still-forming candle or the live price marker that may appear on a chart.
The historical cases match the selected RSI and Bollinger Band categories; they are not identical market situations. “Flat” means the outcome falls within ±0.5 times the historical case’s own return volatility around zero. Cases may overlap.
- 4-hour chart, 12-hour outcome: 1,526 matches; January 18, 2019–October 25, 2026.
- 12-hour chart, 36-hour outcome: 409 matches; February 21, 2019–October 23, 2026.
- Daily chart, three-day outcome: 177 matches; April 17, 2019–October 21, 2026.
These are historical frequencies, not forecasts. They do not measure forecast accuracy or guarantee future returns.
For information only. This is not investment advice.