Bitcoin at a Crossroads: What Today’s 4h, 12h and Daily RSI + Bollinger Reads Say
A timestamped look at the latest closed Binance BTC/USDT candles across 4h, 12h and 1d, with RSI and Bollinger readings compared against ChartSight historical outcome samples. These are historical frequencies, not forecasts or investment advice.
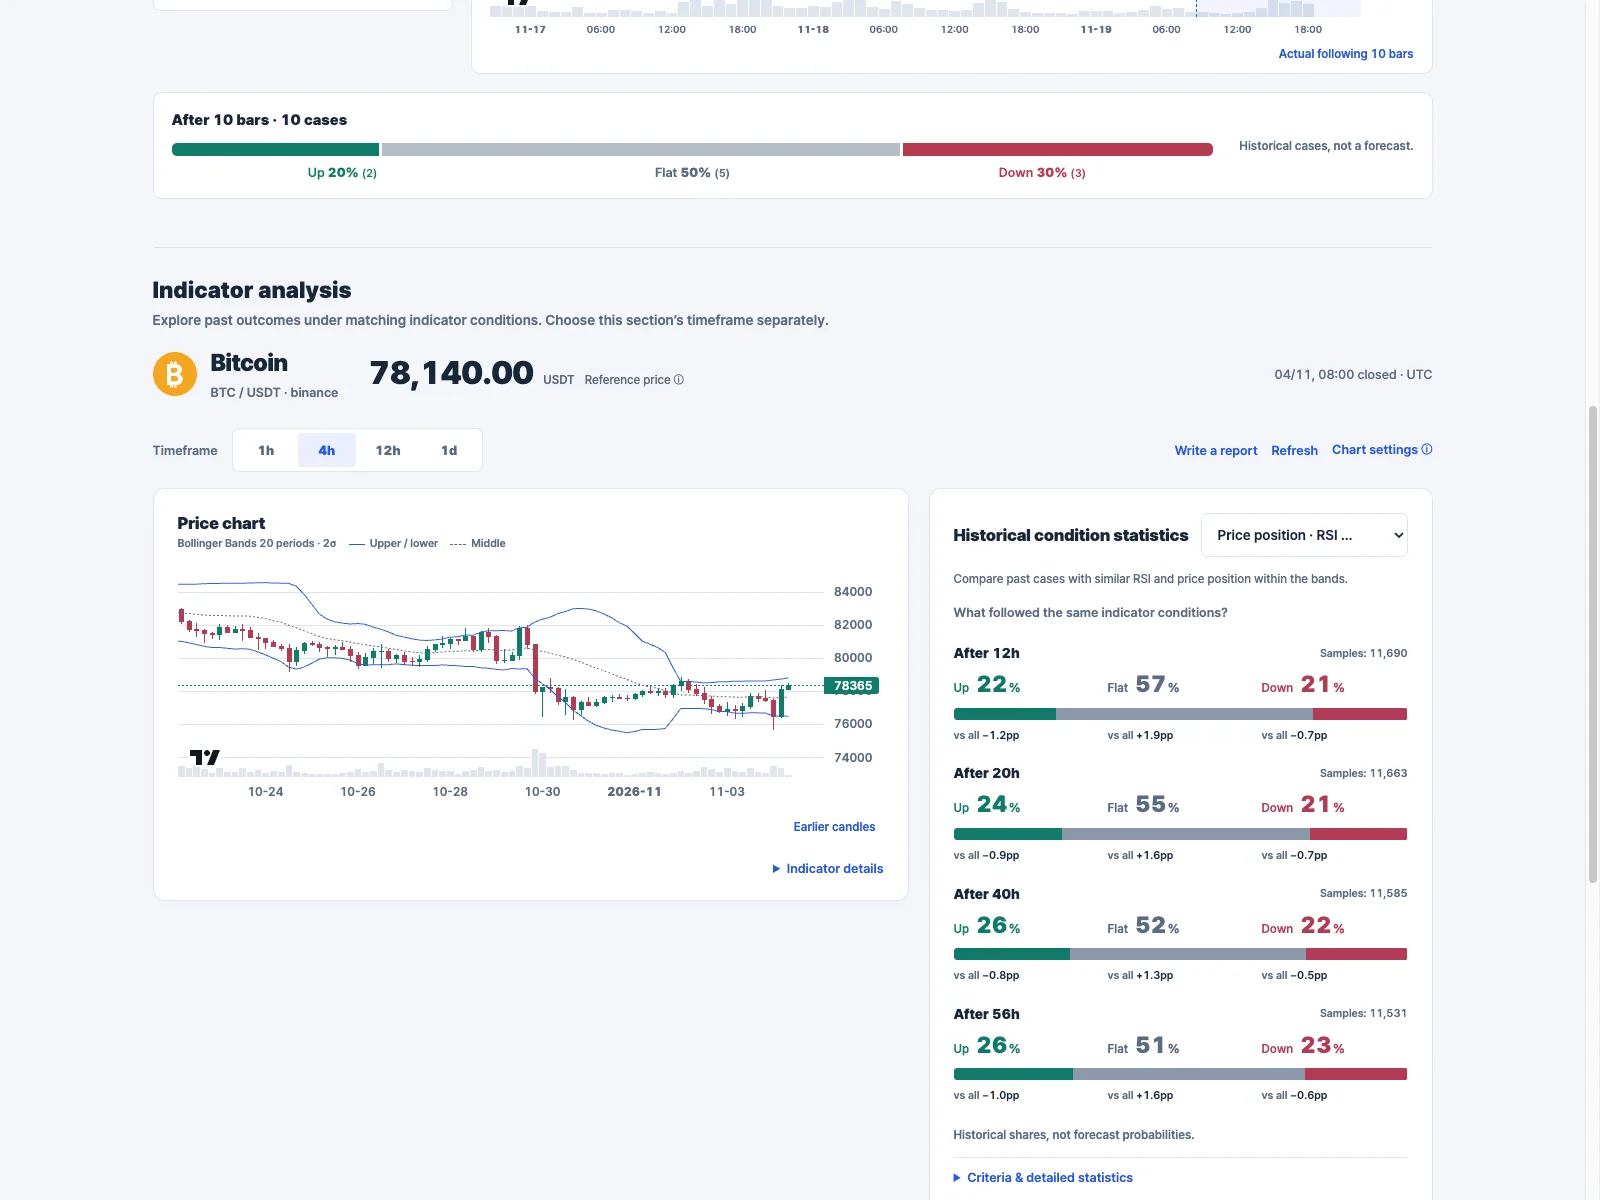
4-hour: RSI is neutral, price sits in the middle band
Closed candle: 2026-11-04 08:00 UTC (reference candle opened at 04:00 UTC). ChartSight reference price: 78,140.00 USDT.
The 14-period RSI was 48.2231, labelled “Neutral zone” (the site’s configured neutral range is RSI ≥20 and <80). Bollinger Bands were 20 periods, 2σ; band position was 73.7348%, labelled “Middle band position” (configured band-position range >10% and <90%). These are position labels, not buy/sell signals.
For the matching RSI + Bollinger condition, the site’s volatility-based summary showed 11,690 matching cases out of 16,319 eligible at 12 hours, over 2019-01-18–2026-11-01 UTC. In the separate fixed-threshold table, a 12-hour closing return of at least +1% occurred in 22.8% of matches versus 23.9% across all cases; a return at or below −1% occurred in 21.0% versus 21.5% across all cases. Those are historical shares, not forecast odds. The two panels use different sample pools and outcome definitions.
Read-through: the RSI is near the middle of its range and the band position is in the middle zone, so this snapshot does not meet ChartSight’s configured RSI or band-position extreme thresholds. The modestly lower historical +1% and −1% shares versus their baselines are mixed evidence, not a directional edge.
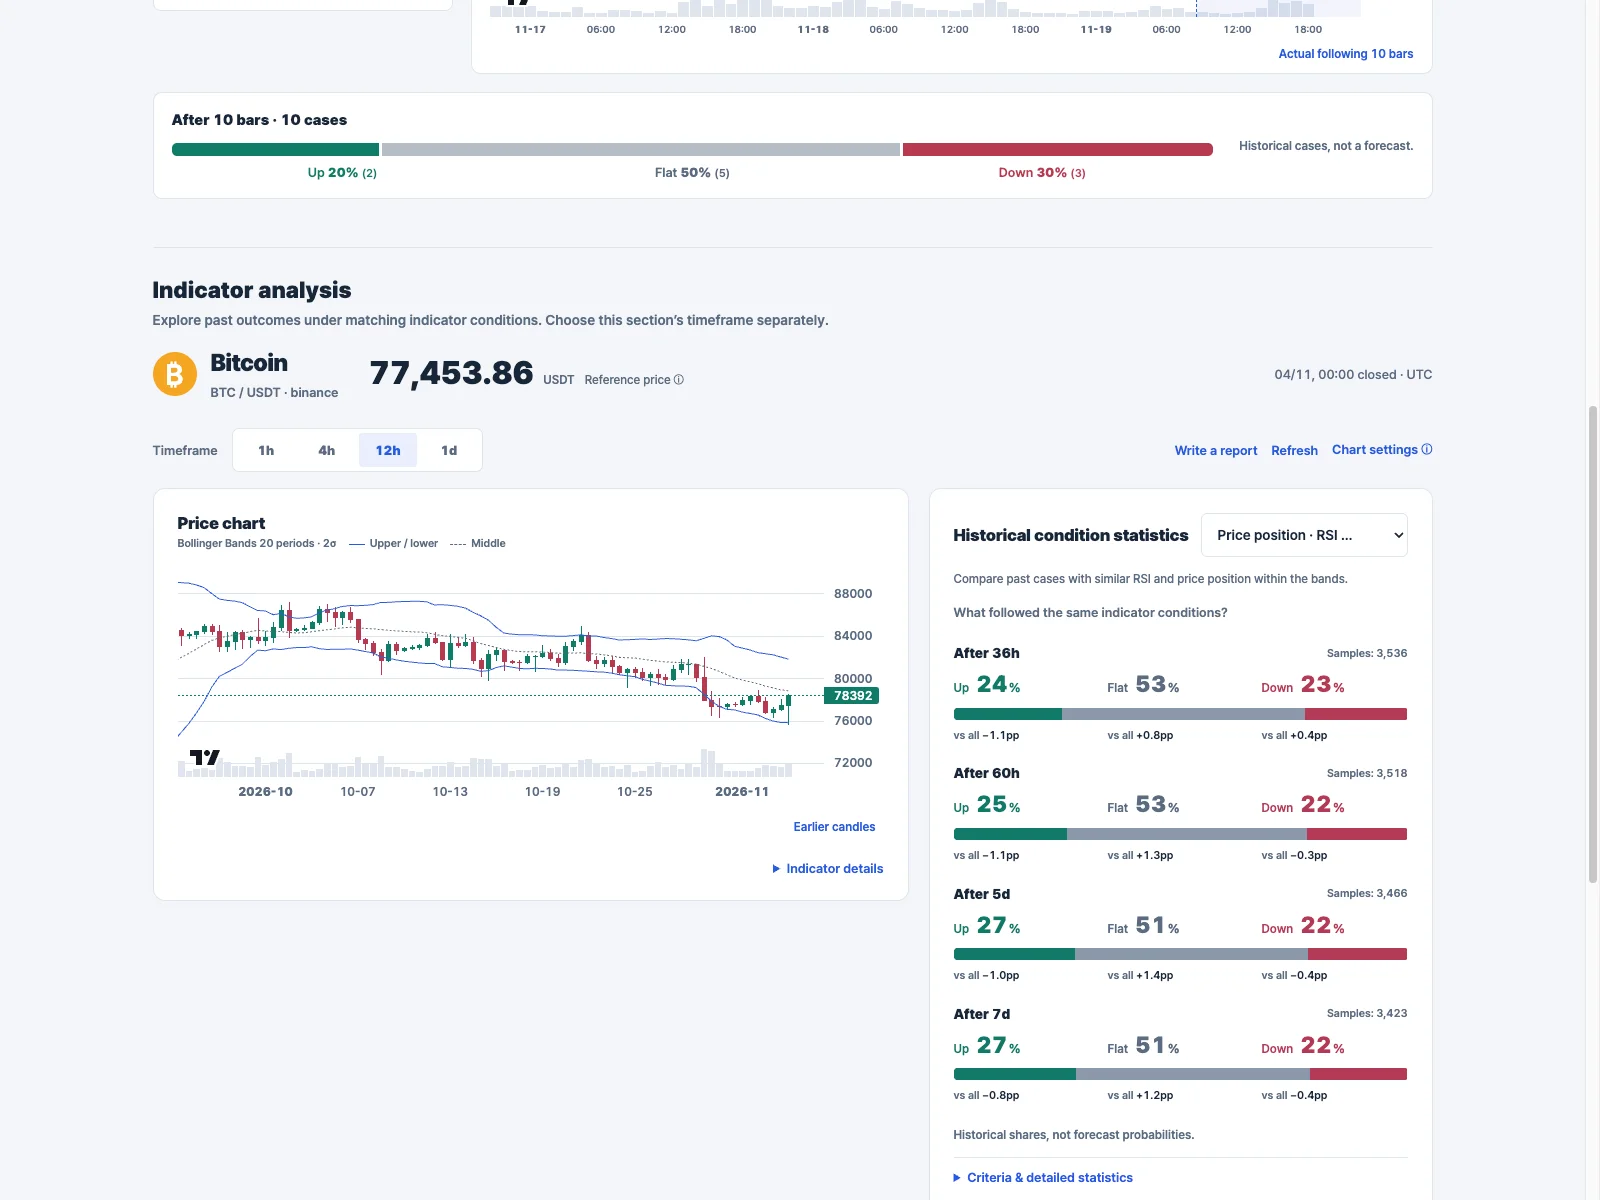
12-hour: low-neutral RSI, but not an oversold reading
Closed candle: 2026-11-04 00:00 UTC (reference candle opened at 2026-11-03 12:00 UTC). ChartSight reference price: 77,453.86 USDT.
The 14-period RSI was 27.393, still labelled “Neutral zone” under the site’s RSI ≥20 and <80 rule. The 20-period, 2σ Bollinger band position was 26.1368%, within the configured middle-band zone (>10% and <90%). The RSI is comparatively low, but it did not cross ChartSight’s stated lower boundary.
The condition summary showed 3,536 matching cases out of 4,958 eligible for 36 hours (three 12-hour candles), over 2019-02-21–2026-10-30 UTC, using a volatility-centered “flat” band of ±0.5σ. In the distinct fixed-threshold table, after 36 hours the close was at least +1% in 34.5% of matches versus 35.6% of all cases, and at or below −1% in 31.5% versus 31.0%. That is a small historical split in opposite directions, not a forecast. The fixed-threshold table’s 36-hour count is 4,059 matching cases (3,598 without imputed data), a different eligible pool from the volatility summary.
Read-through: this timeframe gives the lowest RSI of the three, yet the configured label remains neutral and price is not near the lower band edge. Its historical +1% frequency was slightly below baseline, while the −1% frequency was slightly above it. The differences are descriptive only.
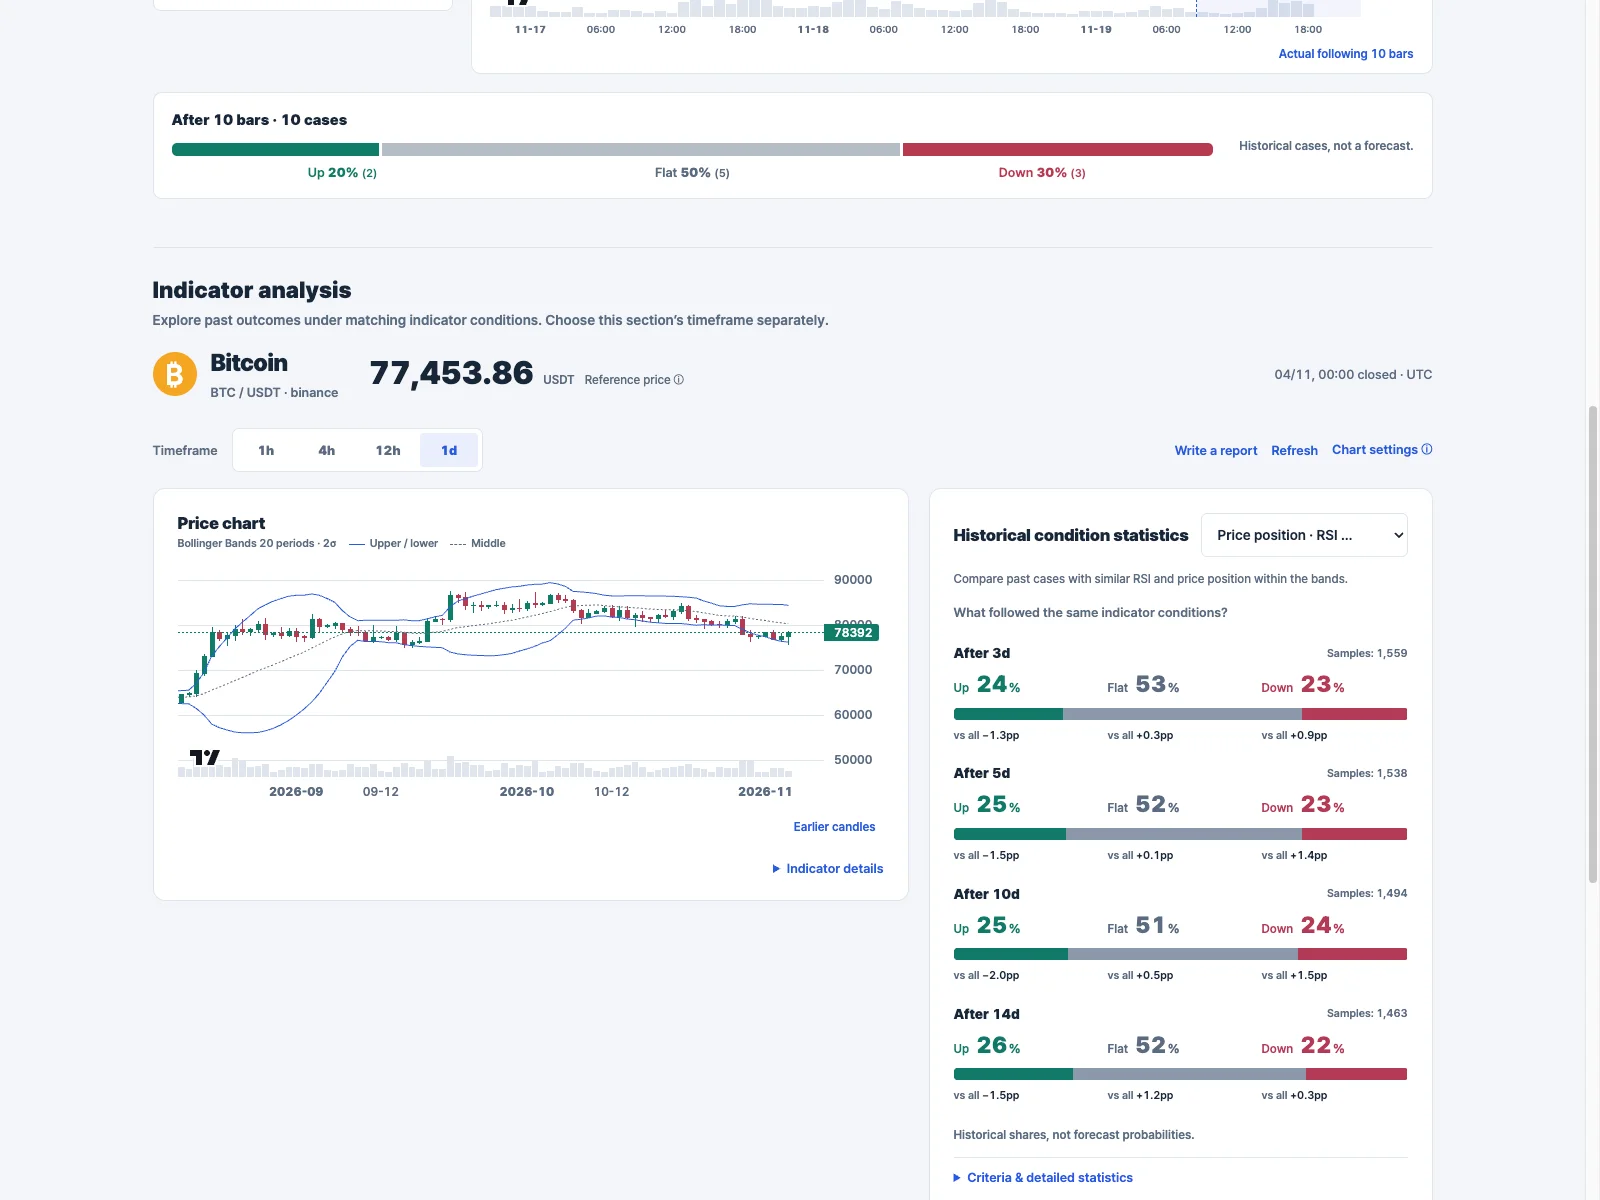
Daily: RSI near the lower end, band position just above its lower zone
Closed candle: 2026-11-04 00:00 UTC (reference candle opened at 2026-11-03 00:00 UTC). ChartSight reference price: 77,453.86 USDT.
The 14-period RSI was 29.102, labelled “Neutral zone” by the configured RSI ≥20 and <80 rule. The 20-period, 2σ Bollinger band position was 13.9155%, still inside ChartSight’s configured middle range (>10% and <90%), but much nearer its lower boundary than the other two readings.
At three days (three daily candles), the volatility-based summary showed 1,559 matching cases out of 2,207 eligible, for 2019-04-17–2026-10-28 UTC. In the fixed-threshold panel, a close at least +1% after three days occurred in 40.7% of matching cases versus 42.3% across all cases. The separate fixed-threshold pool reports 1,997 matching cases (1,597 without imputed data). This is a descriptive difference, not evidence that a future move is less likely.
Read-through: the daily view is the closest of the three to a lower-band condition, while its RSI remains above the configured lower boundary. Its +1% historical share was 1.7 percentage points below the baseline. The 4-hour and 12-hour panels show different, small deviations in either direction; taken together, these are mixed historical comparisons rather than a reliable directional signal.
What these comparisons do, and do not, say
ChartSight’s selected condition was Price position · RSI + Bollinger. RSI uses 14 periods; Bollinger Bands use 20 periods and 2 standard deviations. Band position is the price’s relative location in that band; the site’s configured middle-position interval is >10% and <90%. The site labels states explicitly as not buy or sell signals.
The volatility-based panel classifies historical outcomes as up, flat or down; “flat” is each case’s own return volatility centered on zero, within ±0.5σ, not a normal-distribution assumption. The fixed-threshold table separately reports the share whose closing-price return at the selected horizon reached at least +1% or at most −1% (and other ±3%/±5% thresholds). Its denominator can differ from the volatility panel. Cases may overlap; the baseline includes all clean eligible cases in the same coverage, including matching cases. The interface warns that differences do not establish statistical significance, profitability, or prediction accuracy.
These are look-backs across historical BTC/USDT data, not probabilities of what will happen next. Reference prices differ across the timeframe panels, so they should not be read as one synchronized quote. No investment recommendation is being made. The source does not display a statistical significance test for these differences.
Data basis: ChartSight dashboard, Binance BTC/USDT, indicator combination “Price position · RSI + Bollinger”; latest closed candle shown per timeframe. Observation checked at 2026-11-04 08:31:25.547 UTC. Chart images below/above are direct browser screenshots of ChartSight’s price charts; dates and timeframe labels are retained.