Bitcoin at $80,504: What the 4h, 12h and Daily RSI + Bollinger Reads Show
A look at Binance BTC/USDT indicators from the latest closed candle on 5 November 2026, plus historical outcomes under similar RSI and Bollinger conditions across three timeframes.
Observation and method Observed 5 November 2026 at 00:15 UTC. The latest closed Binance BTC/USDT reference was 80,504.01 USDT at 00:00 UTC. ChartSight compares current RSI and Bollinger conditions with earlier historical cases. These shares describe past outcomes, not a forecast or investment advice.
4-hour view The latest 4h candle opened 4 November at 20:00 UTC and closed 5 November at 00:00 UTC. RSI (14) was 69.6689, which ChartSight labels neutral under its configured 20-to-under-80 range. Bollinger Bands use 20 periods and 2 standard deviations; band position was 106.34%, labeled high (90% or higher). That is a high band position, while RSI remains in the site's neutral zone. Neither reading is a buy or sell signal.
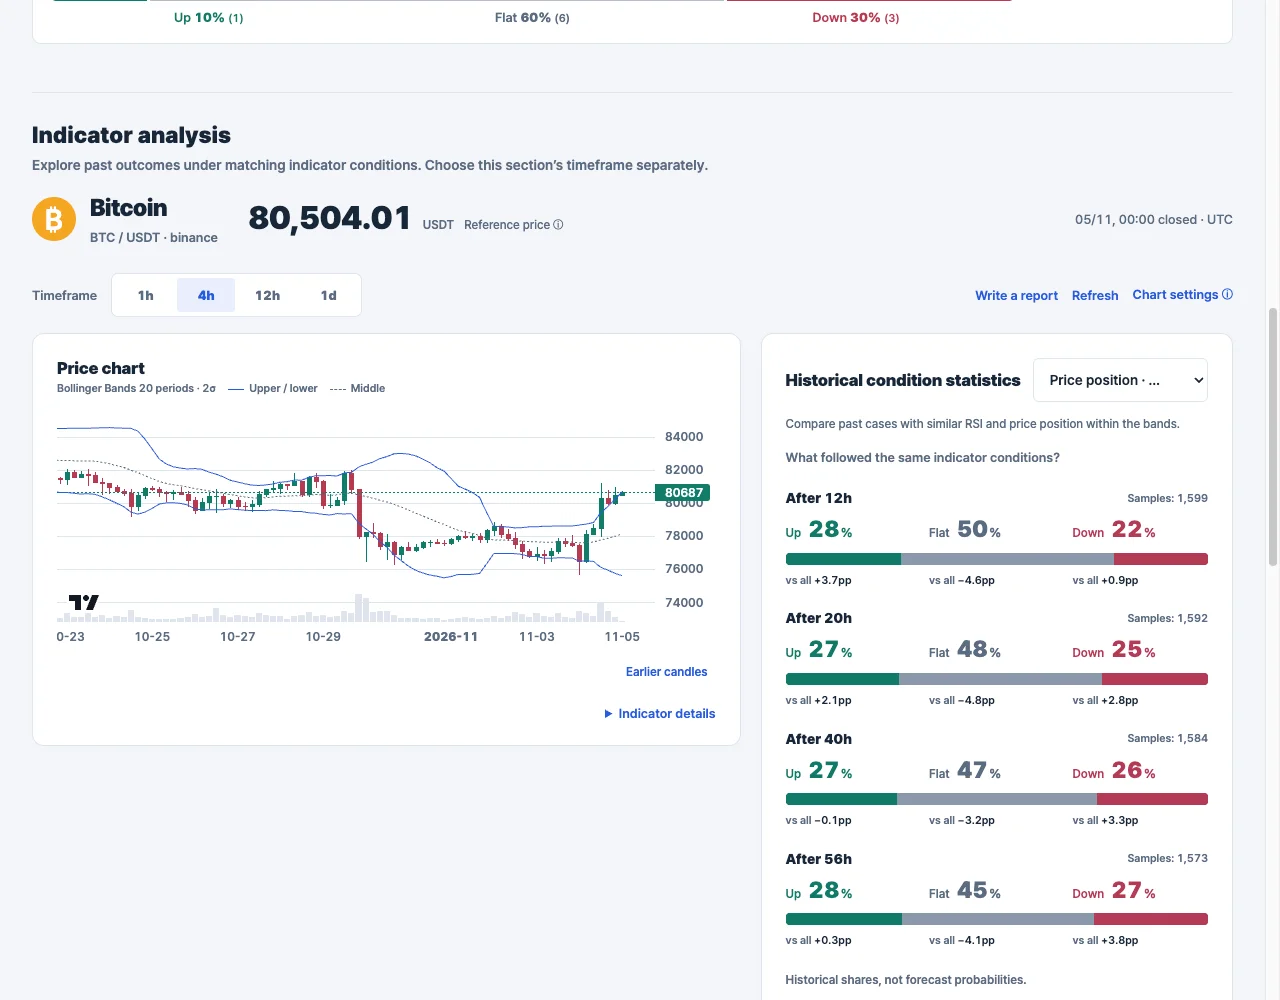
Among matching historical cases, the recorded Up / Flat / Down shares were: after 12h, 28% / 50% / 22% (1,599 matching of 16,319 eligible cases); after 20h, 27% / 48% / 25% (1,592 / 16,279); after 40h, 27% / 47% / 26% (1,584 / 16,179); after 56h, 28% / 45% / 27% (1,573 / 16,099). The coverage ran from 18 January 2019 to 1 November 2026 at 12h, 18 January to 31 October at 20h, and 19 January to 30 October at 40h and 56h (UTC). The flat band is based on each historical case's own return volatility, within ±0.5σ of zero.
Interpretation: flat was the most common individual outcome at each 4h horizon. Up and down shares are close: the up share is higher than the down share at each of these horizons. Relative to all eligible cases, the displayed differences vary by outcome and horizon. These small differences are not proof of an edge.
Chart note: the screenshot shows the closed 00:00 UTC reference price and indicator statistics. The chart itself may also display a candle that was still forming at observation time.
12-hour view The 12h candle opened 4 November at 12:00 UTC and closed 5 November at 00:00 UTC. RSI (14) was 45.9089, neutral under ChartSight's configured 20-to-under-80 range. Bollinger Bands (20 periods, 2σ) put price at 77.5186% of the band range, a middle-band position (above 10% and below 90%). This is a more middle-of-range reading than the 4h chart.
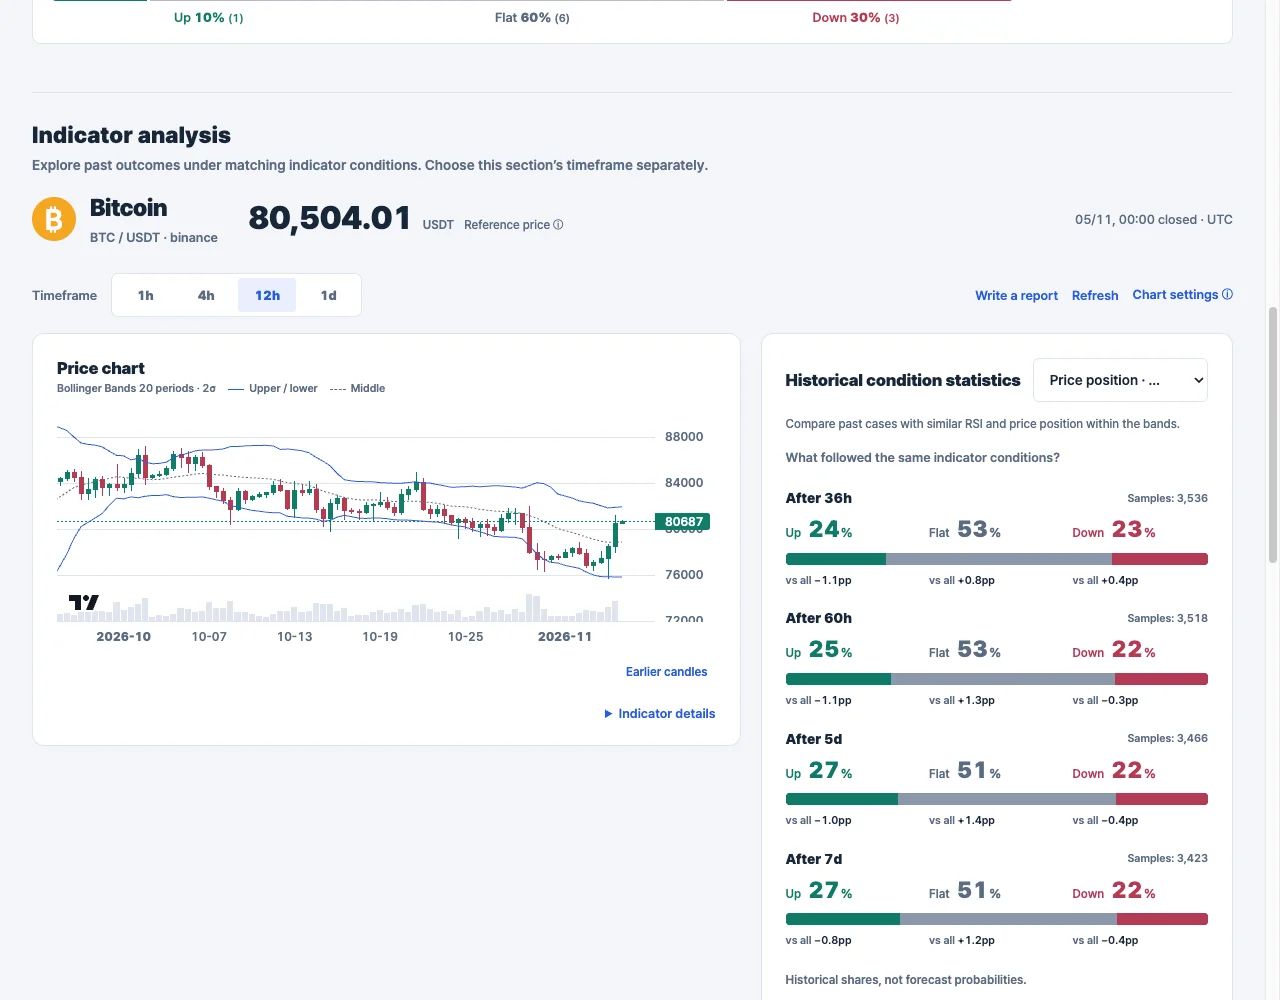
For matching historical cases, Up / Flat / Down shares were: after 36h, 24% / 53% / 23% (3,536 matching of 4,958 eligible); after 60h, 25% / 53% / 22% (3,518 / 4,924); after 5d, 27% / 51% / 22% (3,466 / 4,841); after 7d, 27% / 51% / 22% (3,423 / 4,780). Coverage by horizon was 21 February 2019–30 October 2026 for 36h, 22 February 2019–29 October 2026 for 60h, 24 February 2019–27 October 2026 for 5d, and 26 February 2019–25 October 2026 for 7d (UTC).
Flat is ChartSight's volatility-based band: within ±0.5σ of zero using each historical case's own return volatility. Compared with all eligible cases, Up was 0.8–1.1 percentage points lower, Flat 0.8–1.4 points higher, and Down ranged from 0.4 points lower to 0.4 points higher. This is mixed, mostly flat historical evidence, not a directional forecast. Cases may overlap and these differences do not establish statistical significance.
The screenshot is the 12h ChartSight view. Its reference metrics are for the closed 00:00 UTC candle; the plotted chart may show a still-forming candle.
Daily (1d) view The daily candle opened 4 November at 00:00 UTC and closed 5 November at 00:00 UTC. RSI (14) was 38.2866, which ChartSight labels neutral under its configured 20-to-under-80 range. Bollinger Bands (20 periods, 2σ) put price at 52.294% of the band range, a middle-band position. The daily reading is also neutral by the site's labels.
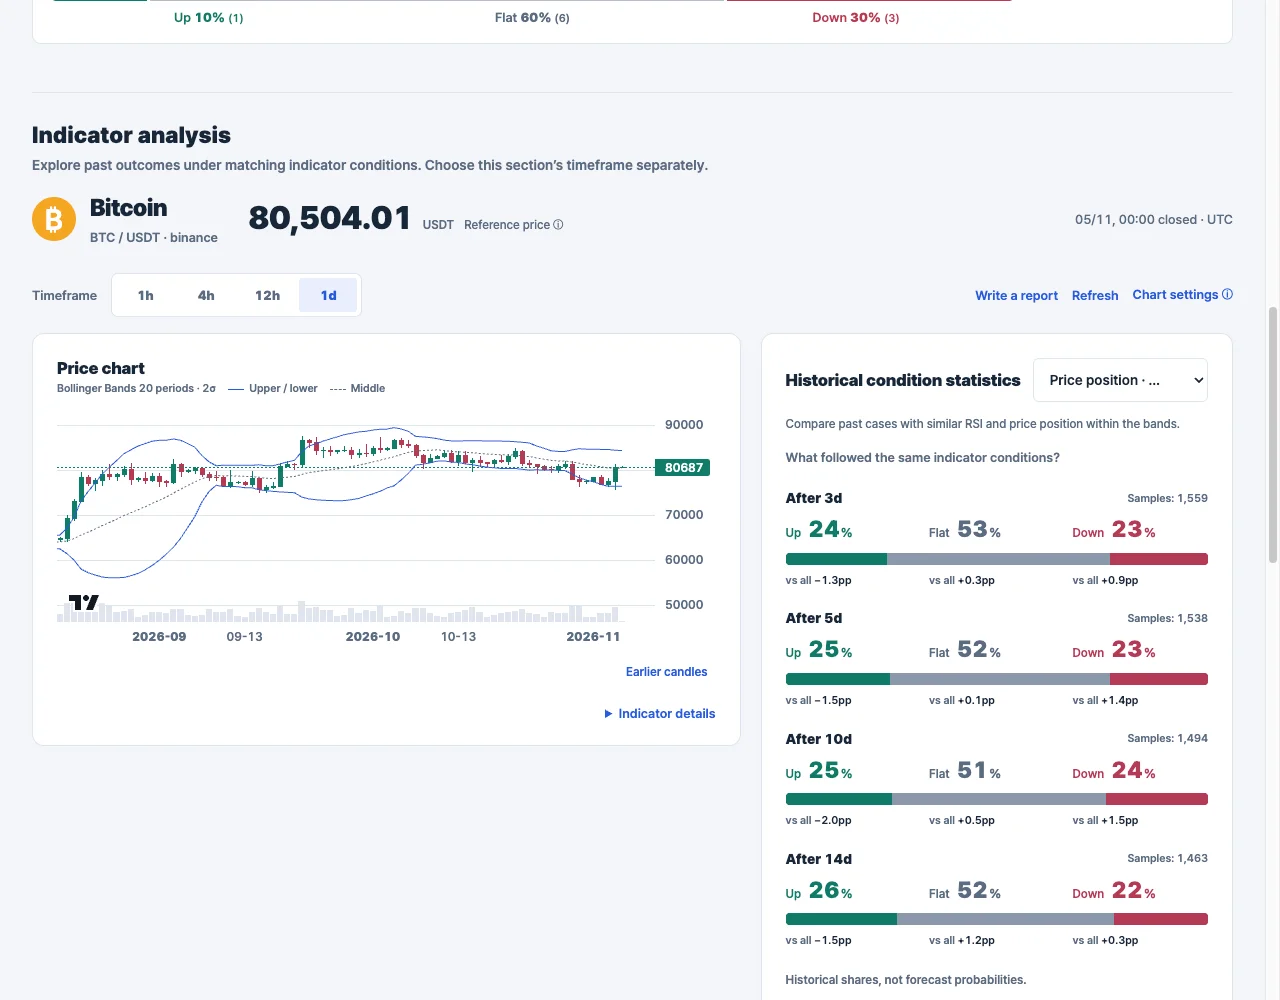
For matching cases, Up / Flat / Down shares were: after 3d, 24% / 53% / 23% (1,559 matching of 2,207 eligible); after 5d, 25% / 52% / 23% (1,538 / 2,177); after 10d, 25% / 51% / 24% (1,494 / 2,102); after 14d, 26% / 52% / 22% (1,463 / 2,057). Historical coverage was 17 April 2019–28 October 2026 at 3d, 21 April–26 October at 5d, 1 May–21 October at 10d, and 19 June–17 October at 14d (UTC).
Flat uses the same ±0.5σ volatility band around zero. Compared with all eligible cases, Up was 1.3–2.0 percentage points lower, Flat 0.1–1.2 points higher, and Down 0.3–1.5 points higher. Flat outcomes were most common at every horizon, and the directional shares stayed fairly close. This is mixed historical evidence, not a forecast.
How to read these results The percentages are historical frequencies among cases that matched the current RSI and price position within Bollinger Bands. Flat means a return within ±0.5σ of each historical case's own return volatility, centered on zero; Up and Down are on either side of that flat band. ChartSight says this does not assume a normal distribution. The separate fixed ±1%, ±3% and ±5% closing-price grid uses a different sample pool. Eligible samples change by horizon, historical cases can overlap, and differences from the all-case baseline do not establish statistical significance. The reference metrics here use the closed 00:00 UTC candles; ChartSight's plotted chart may still show a forming candle. These statistics are not investment advice.