Bitcoin Near $77,600: What the 4-Hour, 12-Hour and Daily Charts Show
A look at completed Bitcoin 4-hour, 12-hour and daily candles and what followed similar RSI and Bollinger Band conditions in past data. Historical comparisons are not forecasts.
Bitcoin has fallen sharply. Is the market beginning to steady, or is the apparent pause only a break in a weaker trend? We compared the latest completed Binance BTC/USDT candles with past cases in the same RSI and Bollinger Band categories, using ChartSight data checked around 14:34 UTC on October 31, 2026.
4-hour: A more balanced short-term picture
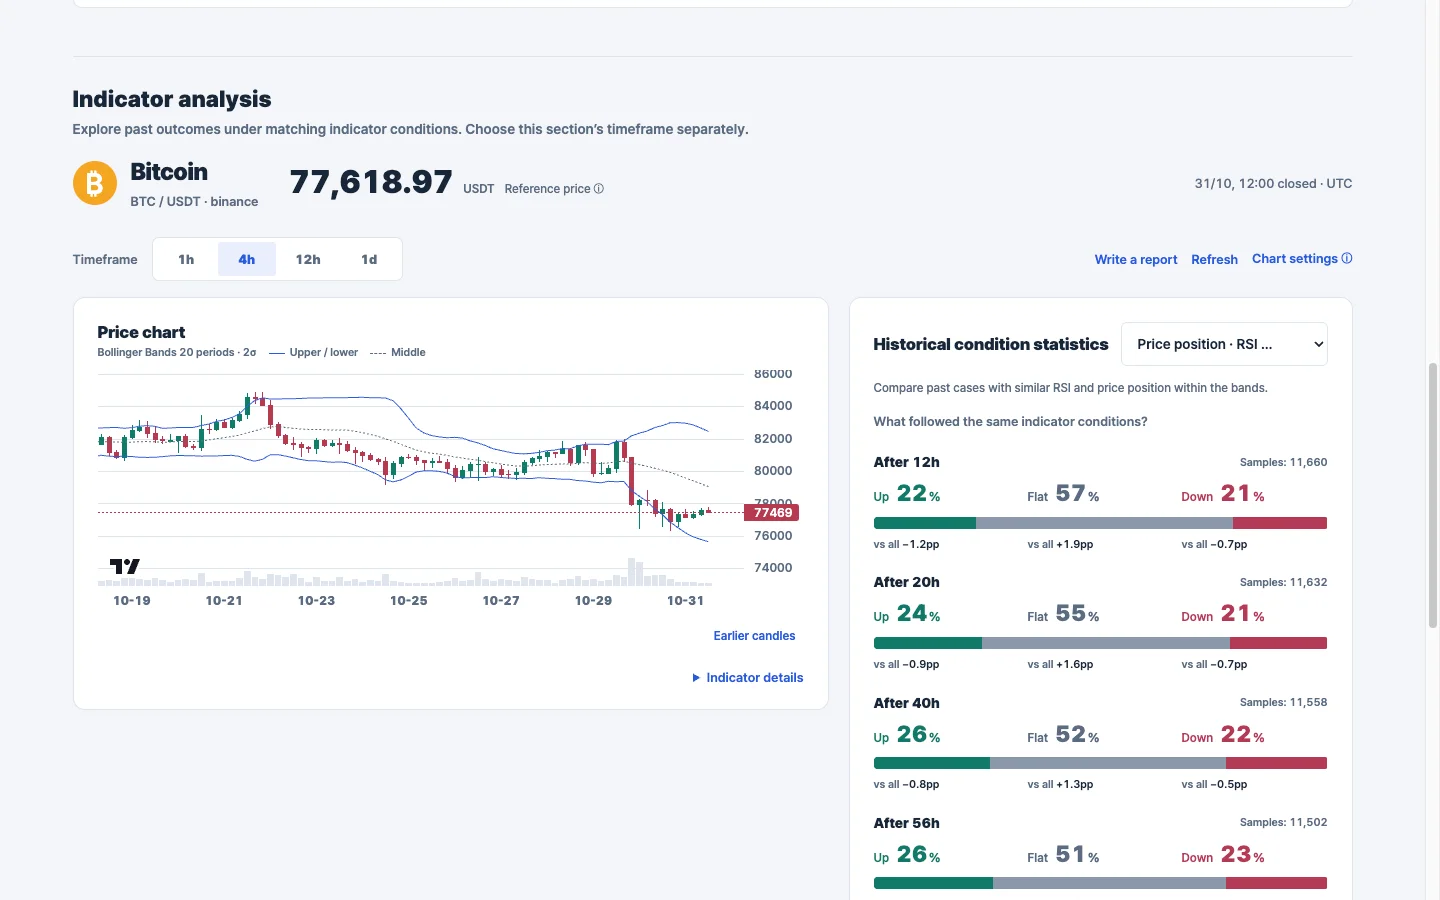
The completed four-hour candle closed at 77,618.97 USDT at 12:00 UTC. Its RSI was 37.27, and its Bollinger Band position was 26.79%. Both fell in ChartSight’s configured middle categories.
Across 11,660 matching historical cases, outcomes 12 hours later were 22% up, 57% flat and 21% down. The upward and downward groups were nearly equal; the largest group was flat. The matching sample spans January 18, 2019 to October 25, 2026 UTC.
This does not mean the price cannot move sharply. It says that, by this particular volatility-based classification, past matching cases were more often inside the flat range after 12 hours.
12-hour: Weakness remains, but history does not promise a rebound
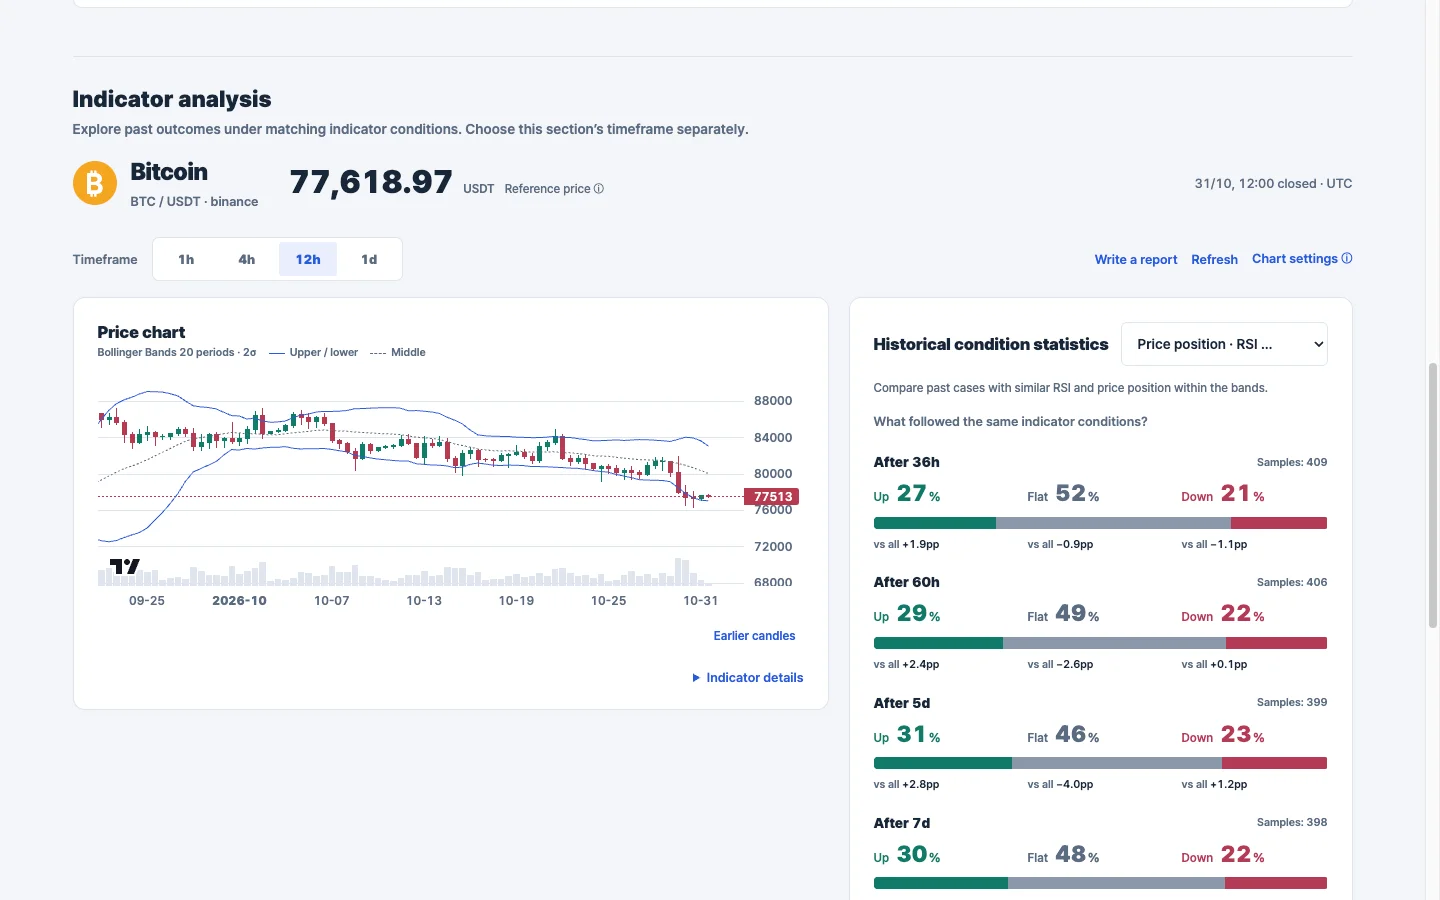
The latest completed 12-hour candle also closed at 77,618.97 USDT at 12:00 UTC. Its RSI was about 29.99, close to a commonly watched threshold of 30, while its Bollinger Band position was 8.22%. ChartSight’s selected classification places that RSI in its configured middle category and the band position in its lower category. Neither is a buy signal.
Of 409 eligible historical cases in the same categories, the 36-hour outcomes were 27% up, 52% flat and 21% down. The comparison window was February 21, 2019 to October 23, 2026 UTC. More cases were up than down, but most were flat under this definition. This same broad category can persist across several snapshots, so its historical percentages need not change every day.
Daily: The broader picture still looks weak
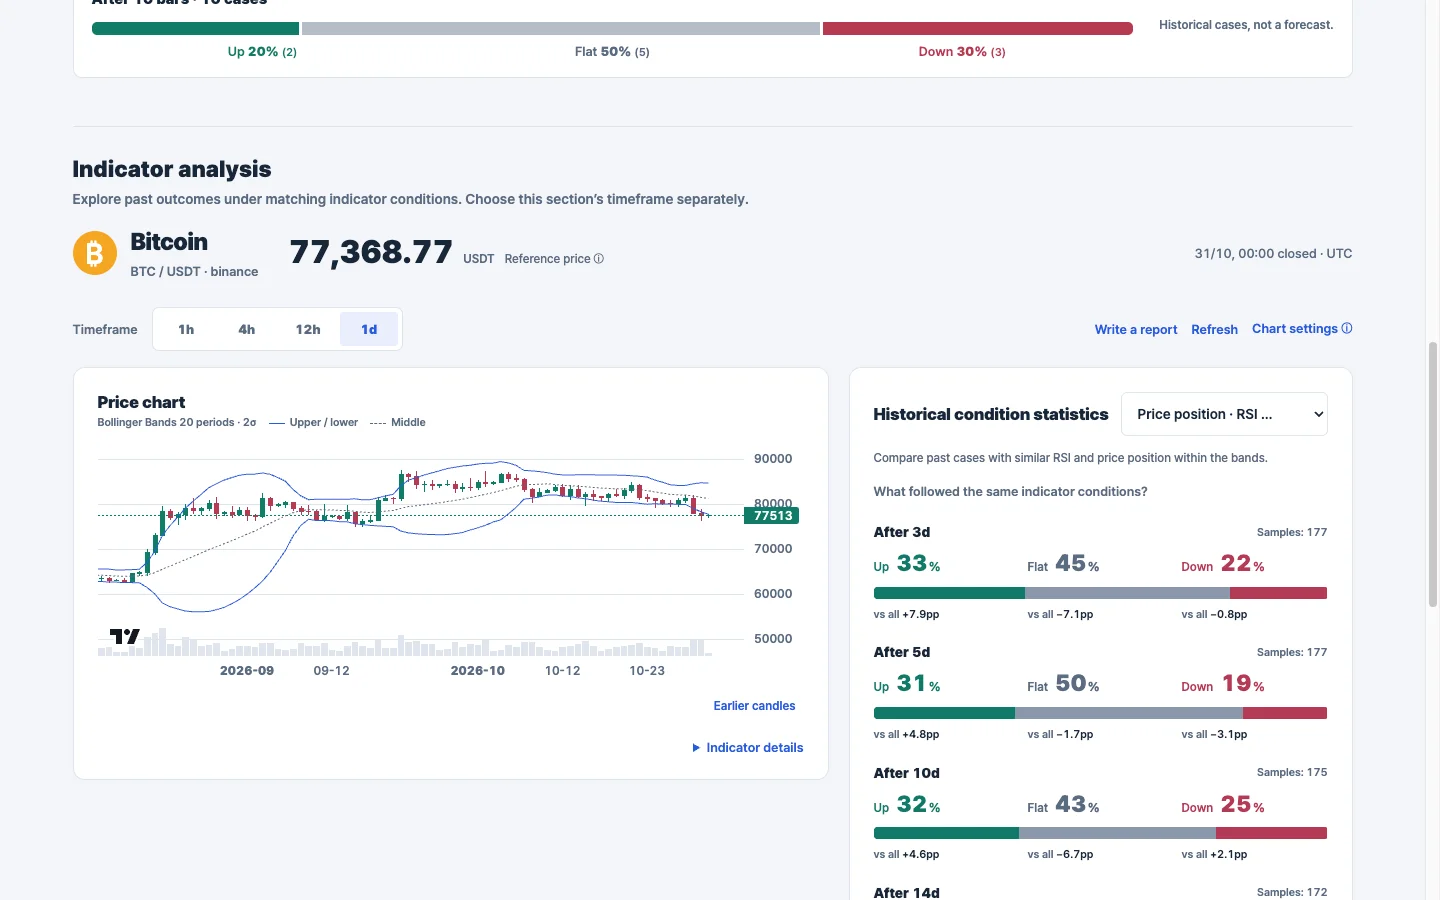
The completed daily candle closed at 77,368.77 USDT at 00:00 UTC on October 31. Its RSI was 32.58 and its Bollinger Band position was −12.80%, below the lower band. This reference candle is older than the four-hour and twelve-hour closes because the timeframes end at different times.
In 177 matching daily cases from April 17, 2019 to October 21, 2026 UTC, the outcomes three days later were 33% up, 45% flat and 22% down. The up share was 7.9 percentage points above the broader set of 2,200 eligible cases. The historical cases can overlap, and the difference does not establish statistical significance.
What to watch
The four-hour comparison is almost even between up and down, while the 12-hour and daily comparisons show more historical up than down cases. Those comparisons use different candles, conditions and follow-up windows; they cannot be combined into one forecast. Watch whether later completed candles move away from the lower band or whether weakness continues, without assuming either outcome.
How to read the numbers
Each timeframe uses RSI(14) and Bollinger Bands(20, 2σ), grouped into ChartSight’s selected categories. The outcome measures the closing-price change at the stated future horizon, not every price touched along the way. Flat means a return within ±0.5 of the historical case’s own return volatility; it is not necessarily an unchanged price. The sample counts and periods above refer to those outcome groups.
The reference close used for the statistics is not necessarily the live price marker visible on each chart. Data and captures are a snapshot; prices may have moved since. Historical frequencies are not forecasts, a measure of future accuracy, or a guarantee of returns. For information only, not investment advice.